Top Bandwidth Management Tools: Compare 10 Solutions For
Find top bandwidth management tools for traffic arbitrage, scraping & ad ops. Compare 10 solutions to control & prioritize network traffic in 2026.
You're already watching it happen. A few hundred browser profiles spin up in AdsPower, Dolphin Anty, GoLogin, Multilogin, or Hidemyacc. A TikTok campaign starts pushing traffic through geo-targeted residential IPs. A scraper hits a hot endpoint, an account-farming batch wakes up, and your latency jumps before you can tell which process did it. That's the point where bandwidth management tools stop being “network software” and become part of your ops stack.
Control Your Traffic, Control Your Costs. When your workload depends on stable sessions for Facebook and TikTok ad accounts, cloaking flows, or multi-account hygiene, uncontrolled bandwidth turns into broken logins, stalled uploads, and noisy IPs. You don't need theory first. You need tools that let you cap the problem, isolate the source, and keep the rest of the machine moving. For a practical reference point on raw bandwidth monitoring, see this guide on RTSP-to-HLS bandwidth monitoring.
Table of Contents
- 1. NetLimiter
- 2. NetBalancer
- 3. GlassWire
- 4. cFosSpeed
- 5. ManageEngine NetFlow Analyzer
- 6. SolarWinds NetFlow Traffic Analyzer
- 7. Kentik
- 8. Plixer Scrutinizer and Plixer One
- 9. Paessler PRTG Network Monitor
- 10. MikroTik RouterOS Queues
- Top 10 Bandwidth Management Tools, Feature Comparison
- Select the Right Tool for Your Operation
1. NetLimiter
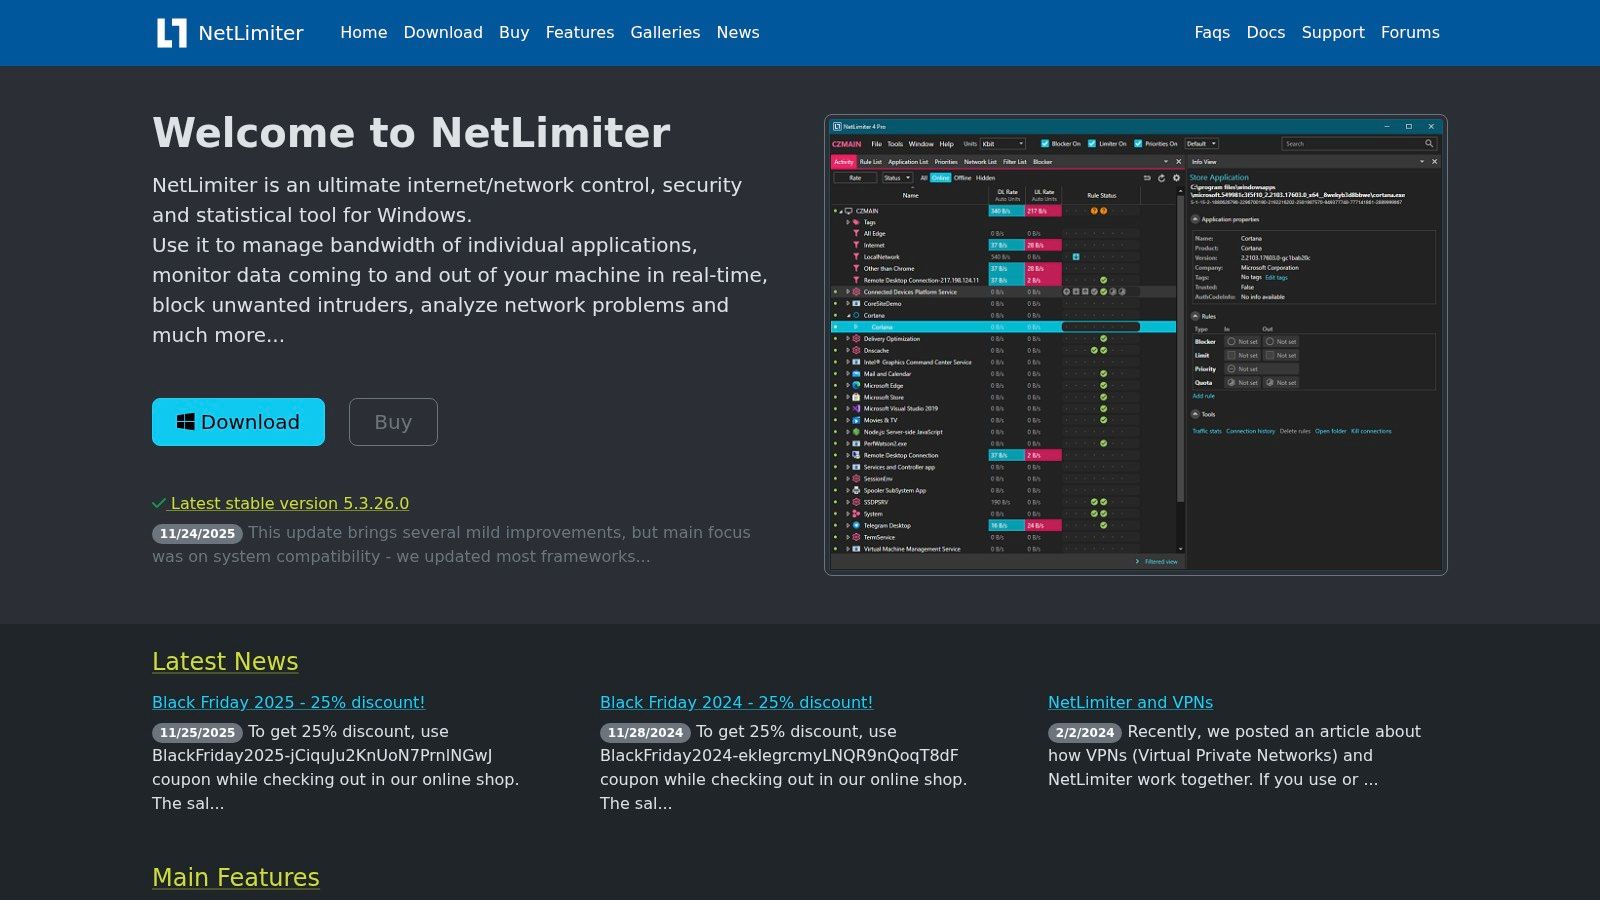
NetLimiter is the cleanest answer when one workstation causes the mess. If you're running AdsPower profiles, scraping jobs, or a stack of browser instances on a Windows desktop or VM, you need per-application control before you need anything fancier. NetLimiter gives you upload and download limits by app, plus rules that let you isolate traffic by IP, port, protocol, schedule, or VPN exception. Visit the product site at NetLimiter and the internal glossary reference at Sota Proxy bandwidth glossary.
Practical rule: Use NetLimiter when you need to stop one profile group from stealing the circuit while keeping launch-critical traffic alive.
Its real value is speed. You can adjust limits fast, watch the effect in real time, and keep long-term history for later review. That matters in account-farming setups, where a single runaway updater or sync process can wreck the stability of everything else on the host.
Best fit and trade-offs
NetLimiter is strong on desktop-level precision. It works well when the operator, not the network team, needs to act immediately. If you run a small farm of Windows VMs for cloaking, campaign testing, or scraper sessions, this is the tool that lets you keep one host from melting the rest.
The trade-off is simple. It's Windows-only, and it doesn't give you a centralized cloud console by default. That makes it ideal for endpoint enforcement, not for managing an entire team's traffic from one pane of glass. Use it to enforce discipline on the machine that's misbehaving, then move up-stack only if the problem is wider than the host.
2. NetBalancer
NetBalancer is the better fit when you want persistent per-process control across multiple Windows machines. If your media buyers or ops team work on separate desktops and you want the same policy logic everywhere, NetBalancer gives you per-process limits, priorities, and rules that can key off networks, IP ranges, ports, and time windows. Start at NetBalancer and pair it with Sota Proxy rate limiting if you're aligning endpoint caps with proxy-side controls.
Its strongest feature for operators is persistence. You're not just reacting to a spike, you're building a repeatable policy. That's useful when you have recurring launch windows for Facebook ad accounts, scheduled scraping jobs, or multi-account work that must stay within a predictable traffic envelope.
Why operators pick it
NetBalancer makes sense when you need the same rule style on several Windows endpoints without moving to full network observability yet. It includes charts and preserved statistics, so you can compare what happened before and after a rule change instead of guessing.
- Per-process limits and priorities: Good for separating browser profiles, sync clients, and automation tools.
- Rule targeting: Useful when you need time-based shaping or network-specific exceptions.
- Optional sync and VPN services: Helpful if you want policy consistency across more than one machine.
- License model: The one-time option is attractive if you dislike recurring software spend.
The limitation is scope. NetBalancer lives at the endpoint. It won't replace flow analysis, and it won't help you understand the whole circuit if multiple hosts fight for the same link. Use it when policy consistency matters more than centralized visibility.
3. GlassWire
GlassWire is what you put on a workstation when you need to see the noisy app before you need to block it. It shows per-app usage and maps hosts, which is useful when an antidetect browser profile, updater, or background sync job starts talking to destinations you didn't expect. The product site is GlassWire, and the related proxy and firewall context is covered in Sota Proxy's proxy servers and firewalls guide.
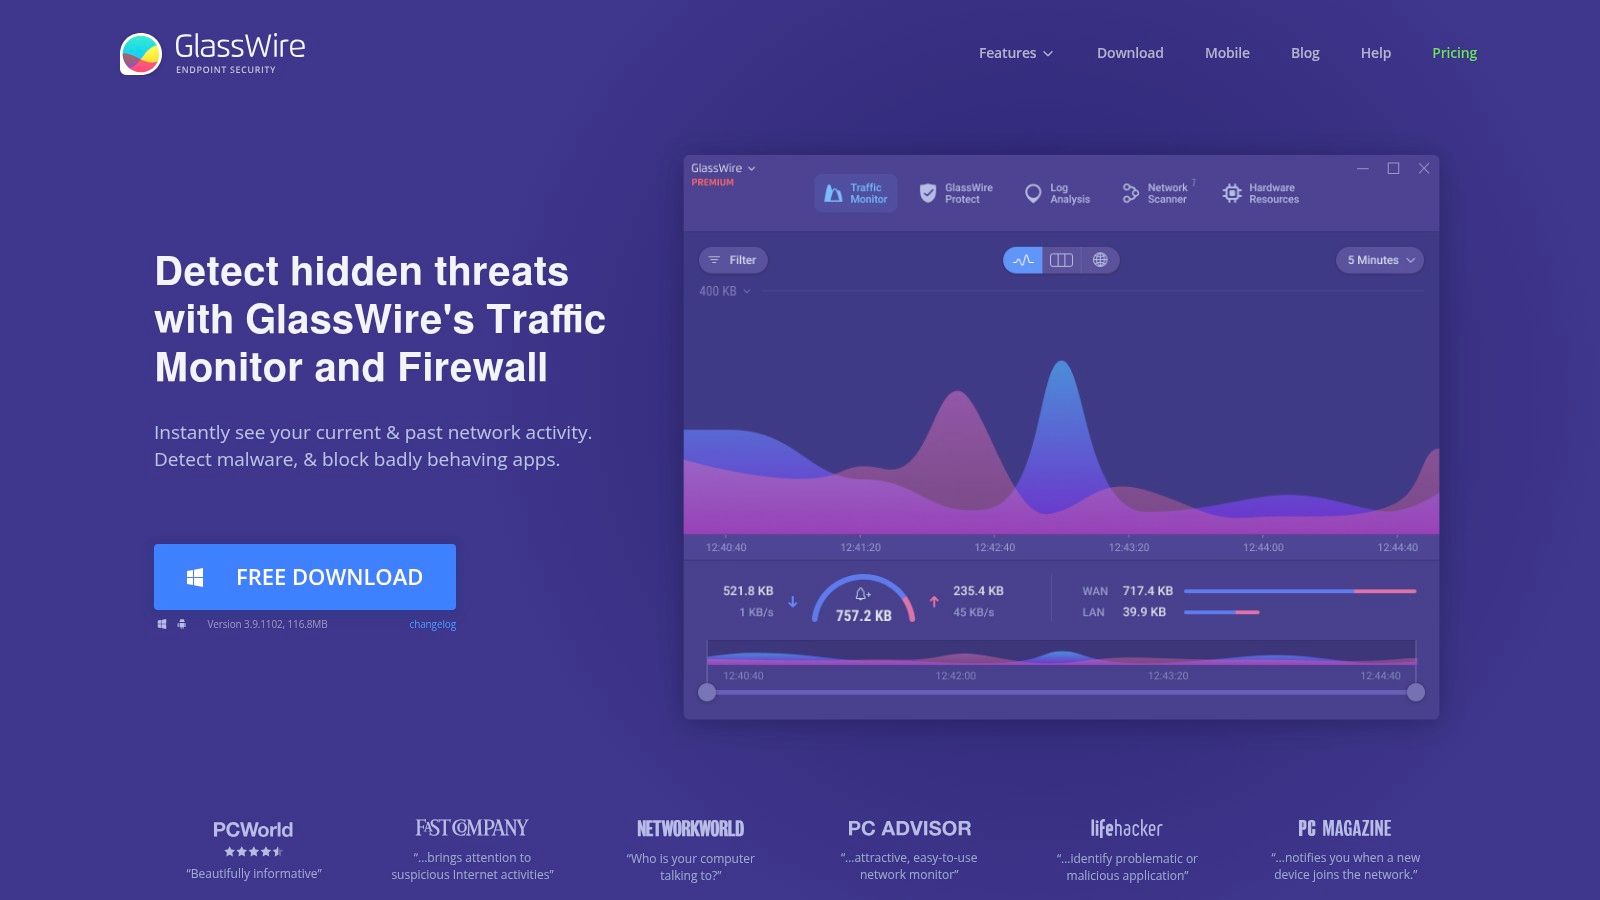
GlassWire works because it makes the culprit obvious. You can click to block offenders and switch into lockdown mode when a machine starts behaving badly. That makes it a practical tool for operators who need a fast visual read on what's consuming bandwidth, not a dense flow console.
Where it fits in a real workflow
Use GlassWire on the machines where you suspect trouble, especially on operator desktops and VM hosts. It's good for catching the app that keeps waking up during a campaign launch or the unexpected service that starts hammering the line during a scrape.
- Per-app visibility: Good for spotting which browser profile or helper service is active.
- Destination mapping: Useful when you need to see where the traffic goes.
- Click-to-block control: Helpful when you need immediate containment.
- Free tier availability: Fine for basic monitoring on smaller workstations.
The downside is scope. GlassWire is endpoint-first. It helps you understand and stop a noisy host, but it won't manage a LAN or tell you which branch, tenant, or proxy cluster is driving aggregate demand. Premium features provide longer history and more alerts, which matters once you start using it as a regular ops tool instead of a one-off debug app.
4. cFosSpeed
cFosSpeed is the latency tool on this list. If you scrape, stream, upload, or move large files while keeping live sessions stable, the problem is often not raw bandwidth. It's bufferbloat and queue behavior. cFosSpeed works at the kernel level on Windows, shaping traffic so ping stays usable under load. Visit cFosSpeed when you care more about stability than dashboards.
That makes it especially relevant for teams that run geo-targeted campaigns while other jobs are still active on the same machine. A machine can be “fast” and still perform badly if the queue fills up during a launch window. cFosSpeed attacks that failure mode directly.
What it solves and what it doesn't
It reduces the pain of asymmetric or overloaded links. If your scraping host, browser farm, or uploader shares a circuit with latency-sensitive sessions, cFosSpeed can keep the interactive traffic from getting buried. It also has low overhead, which matters if you're already stacking automation tools on a Windows box.
But it's not the best tool for per-app governance. NetLimiter and NetBalancer give you sharper application-level control. cFosSpeed is the better choice when the main problem is responsiveness under load, not policy complexity.
It won't tell you why traffic grew. It will make the link behave better while you figure that out.
That distinction matters in ad ops. You use cFosSpeed to protect the session, then use another tool to identify the app, profile, or process that caused the burst in the first place.
5. ManageEngine NetFlow Analyzer
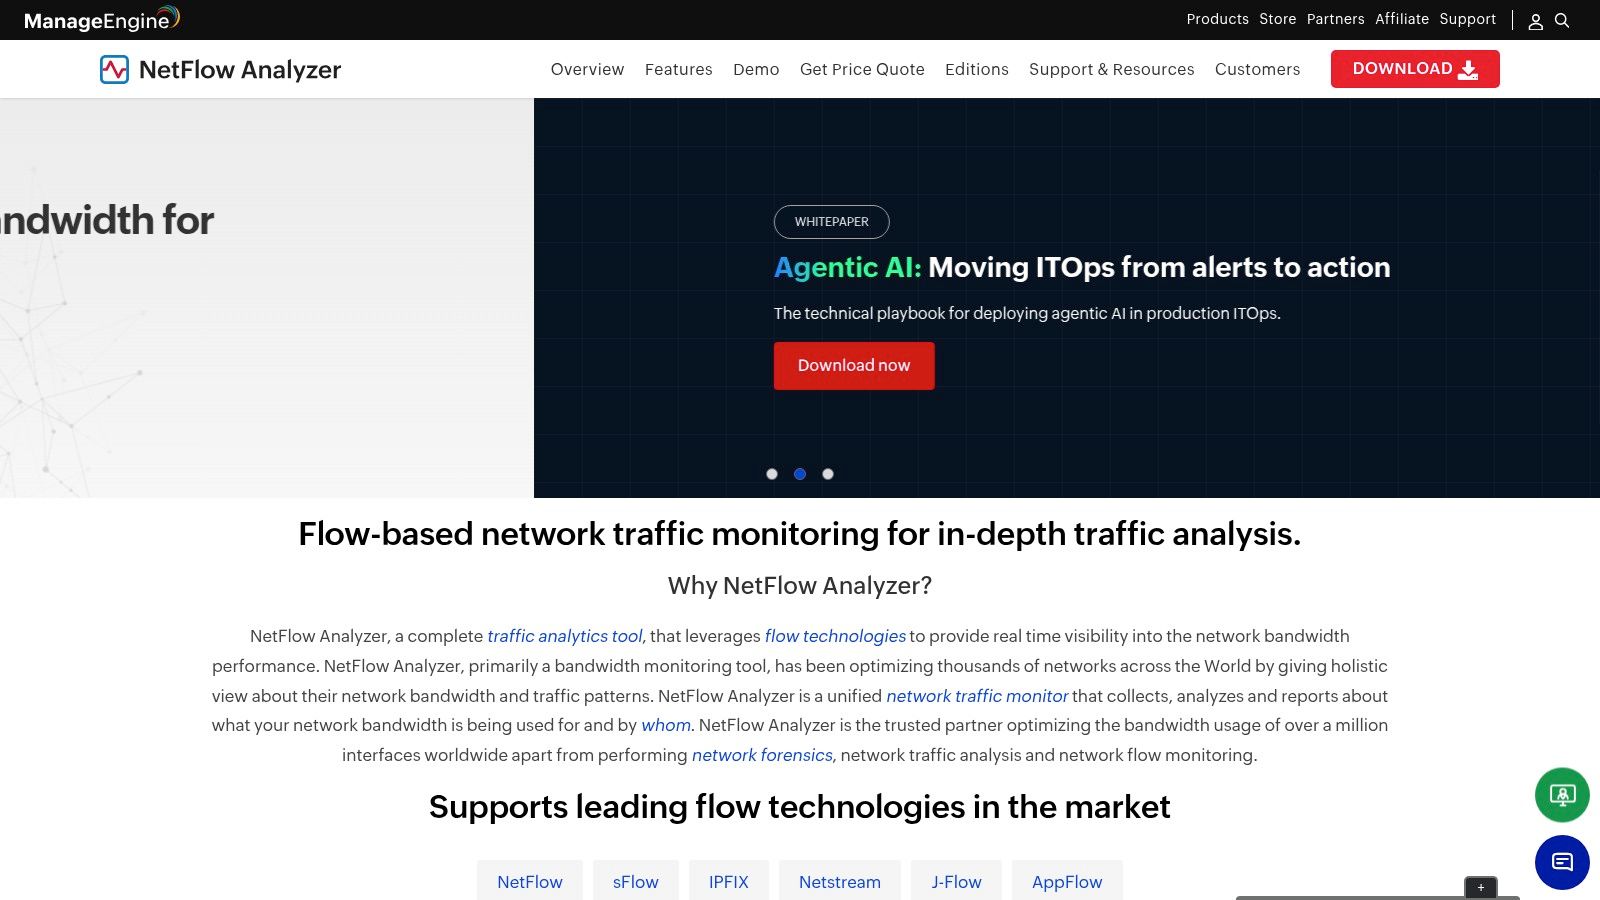
ManageEngine NetFlow Analyzer belongs on the network side of the job. Use it when you need to know who is consuming bandwidth, which conversations are loudest, and how traffic behaves across a WAN. The product page is ManageEngine NetFlow Analyzer.
Its strength is flow visibility. It collects multi-vendor flow data and turns it into dashboards, forensic drilldowns, alerts, billing reports, and QoS validation. That is the level you need when the problem is bigger than one workstation, such as a shared proxy cluster, a branch uplink, or a campaign team hitting the same circuit at the same time.
Why it matters for operators
ManageEngine is the better call when you need proof before policy. If your Facebook and TikTok account teams keep blaming the proxy pool, the ISP, or each other, flow data shows which app, host, or ASN is burning the link.
- Flow collection: Good for NetFlow, sFlow, and IPFIX environments.
- Forensic drilldowns: Useful when a spike needs root-cause analysis.
- QoS validation: Helps confirm that your prioritization is doing what you think.
- Windows or Linux deployment: Useful if your ops stack spans both.
The trade-off is complexity. The reporting depth helps, but it also creates a learning curve. This is not the first tool I would give a solo operator on one Windows machine. It is the tool you bring in when the network has multiple active segments and you need more than a local limiter can provide.
6. SolarWinds NetFlow Traffic Analyzer
SolarWinds NetFlow Traffic Analyzer, or NTA, is the enterprise flow add-on you buy when you already live in the SolarWinds ecosystem. It collects multi-vendor flow data and gives you top talkers, conversation reports, application utilization, interface analysis, and CBQoS visibility. The product site is SolarWinds NetFlow Traffic Analyzer, and the setup context for proxy deployment is covered in Sota Proxy's proxy setup guide.
Use it when your team needs historical traffic analysis across devices, not just a live view of who's loud right now. That makes it a fit for larger operations where campaign traffic, internal tools, and proxy infrastructure all compete across the same estate.
Where NTA fits
NTA works well for teams that already have SolarWinds NPM or the broader Observability stack. If you want one ecosystem for device health, traffic analysis, and dashboards, the integration story is hard to ignore. The documentation depth is also a real advantage when your operations team needs to hand off work cleanly.
The downside is cost and packaging. It's often sold as an add-on, and that can get expensive as you scale. If you only need per-host enforcement for browser farms or scrapers, it's too much tool for the job. If you need enterprise reporting, QoS checks, and deep historical traffic analysis, it belongs on the shortlist.
7. Kentik
Kentik is the right pick when you need cloud-scale visibility and you don't want to manage the observability stack yourself. It ingests NetFlow, IPFIX, sFlow, BGP, SNMP, and cloud VPC flow logs, then gives you fast traffic analysis, DDoS detection, and cost analytics. The product site is Kentik, and Kentik's bandwidth utilization guide explains the common calculation as actual throughput / available bandwidth × 100 and gives the practical example that a 1 Gbps link carrying 600 Mbps is at 60% utilization. That same source also says real-time visibility helps operators spot bottlenecks before users feel them. Kentik bandwidth utilization monitoring
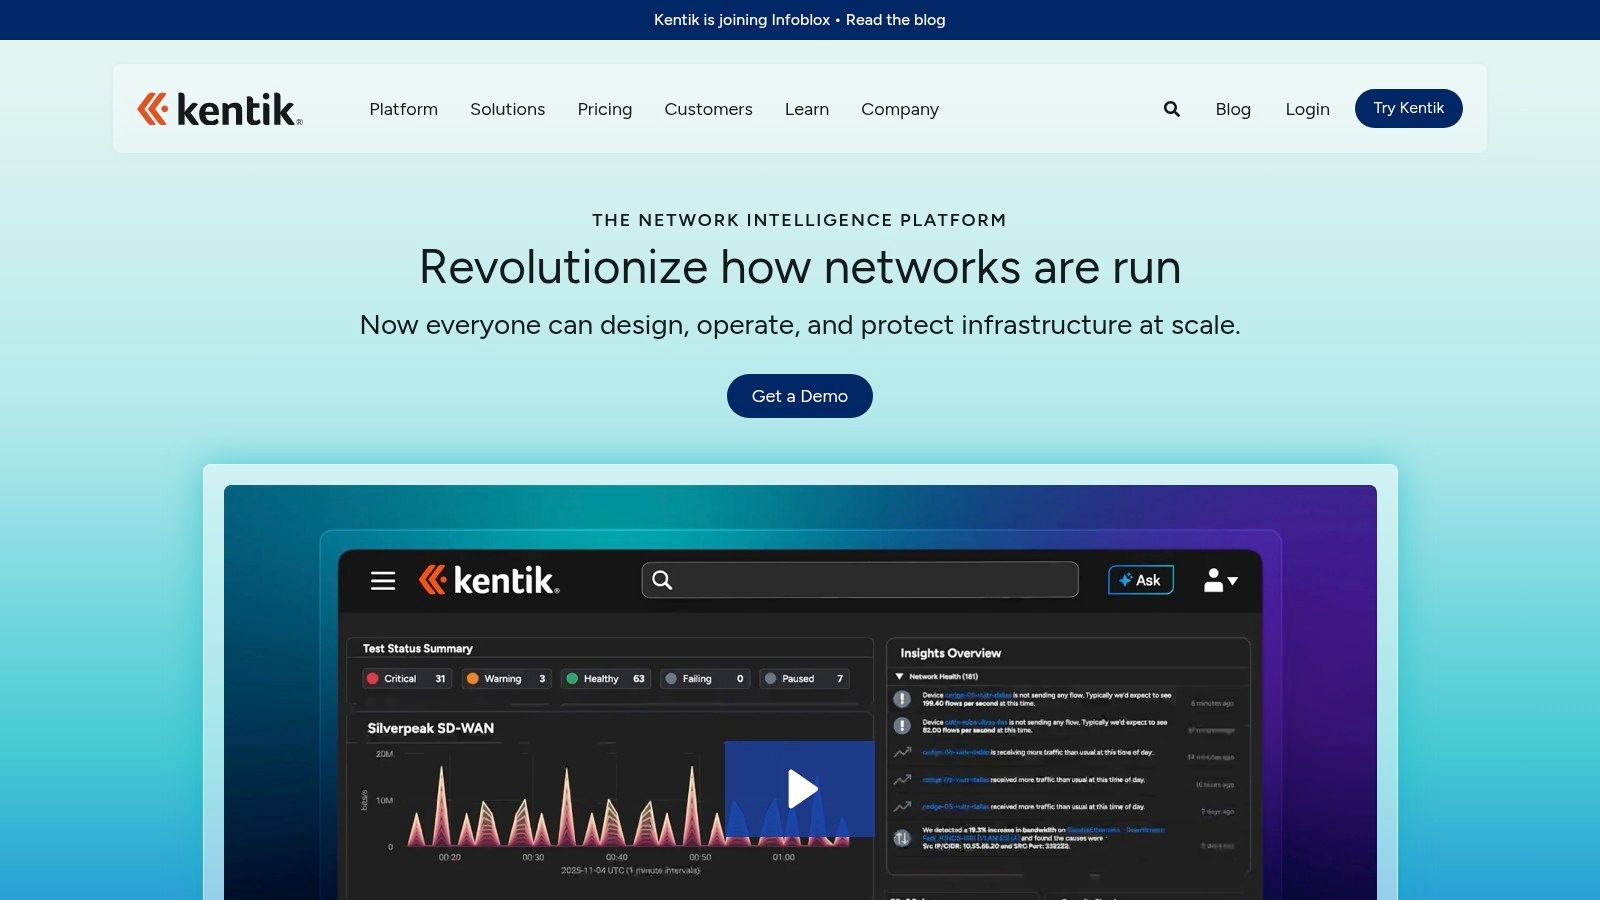
That makes Kentik the best fit when your traffic crosses cloud, on-prem, and multi-site environments. If your proxies, ad infrastructure, and automation pipelines span more than one location, local tools won't give you the aggregate view you need.
Why it stands out
Kentik doesn't just show bandwidth. It helps you understand which applications and destinations drive it, which is the key question in cloud-heavy environments. That matters when TLS, SaaS, and distributed workloads make the payload harder to inspect.
- Fast SaaS analytics: Good for high-volume telemetry.
- Multi-cloud correlation: Useful when on-prem and cloud traffic interact.
- Cost visibility: Helps you see where cloud traffic becomes expensive.
- DDoS detection: Important when abnormal spikes aren't just operational noise.
The trade-off is enterprise orientation. You buy Kentik when you have enough traffic and enough complexity to justify SaaS observability at scale. If your issue is a single Windows host, it's the wrong layer. If your issue is how hundreds of sessions, routes, and services behave together, it's one of the strongest tools on the list.
8. Plixer Scrutinizer and Plixer One
Plixer is the forensic choice. Scrutinizer and Plixer One focus on flow-first investigation, which is exactly what you want when traffic spikes, exfiltration patterns, or misbehaving hosts need to be explained, not just capped. The vendor site is Plixer.
This is the platform for teams that need to move from “the link is hot” to “this host, this conversation, this time window, this behavior.” That's useful in large scraping environments, shared ad-ops networks, and proxy fleets where one bad actor can distort the whole picture.
Why security and performance teams both use it
Plixer's reporting is built for deep investigation, and that's its edge. Security teams care about unusual flows. Performance teams care about the same data for congestion, top talkers, and retention. Plixer lets both groups work from the same metadata without forcing a separate tool for every question.
The learning curve is real. So is the value. If you already know you need long-term retention, detailed drilling, and a flow-centric incident workflow, Plixer earns its place. If you just need to cap bandwidth on a few Windows hosts, it's too heavy.
Direct advice: Put Plixer in front of incidents, not beside them. Use it when you need to explain behavior after the fact and build a policy that stops it from repeating.
It's also the right kind of tool when multiple teams keep debating blame. The data ends the argument faster than opinion does.
9. Paessler PRTG Network Monitor
PRTG is the broadest all-in-one option here. It combines bandwidth monitoring with infrastructure and application metrics, and it covers SNMP, WMI, NetFlow, sFlow, IPFIX, and packet sniffing. The product site is Paessler PRTG Network Monitor. For small labs or sites, the free 100-sensor tier is a useful way to prove the setup before you commit.
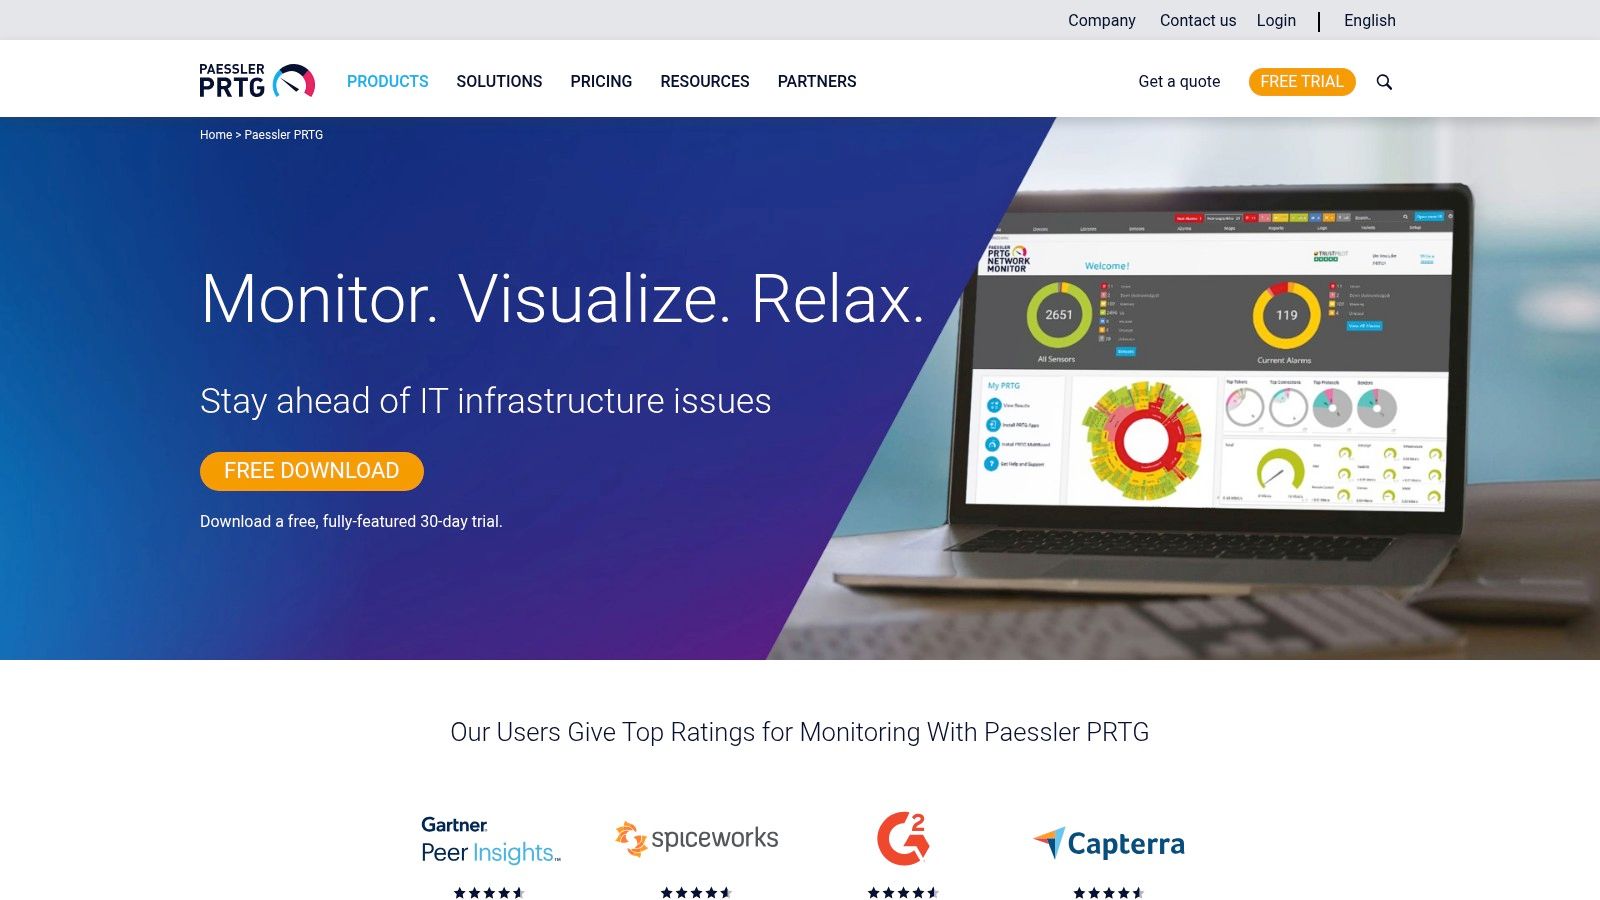
PRTG works when you want one UI for bandwidth, servers, and apps instead of stitching together separate products. That makes it practical for mixed environments where your operator needs to see the network, the server, and the application at the same time.
Where it wins and where it hurts
PRTG is quick to start and flexible. If you're running a small proxy cluster, a testing lab, or a multi-service office network, it gives you a broad base of sensors without forcing you into a flow-only workflow. The alerting and reporting are straightforward, which helps when you need a usable tool fast.
The downside is sensor-based licensing. As scope grows, cost grows with it. You also need to keep an eye on licensing terms because major version and license changes have happened over time, so verify the current setup before rollout. For many teams, PRTG is the practical midpoint between endpoint tools and heavyweight enterprise observability.
10. MikroTik RouterOS Queues
MikroTik RouterOS Queues are the best value in the entire list if your control point sits at the edge. If you manage proxy clusters, subscriber groups, or a network segment with many competing users, RouterOS gives you Simple Queues, Queue Trees, HTB hierarchy, PCQ, and bufferbloat controls like CoDel, FQ-CoDel, and CAKE. The official documentation is MikroTik RouterOS Queues, and the proxy category context is in Sota Proxy's proxy types guide.
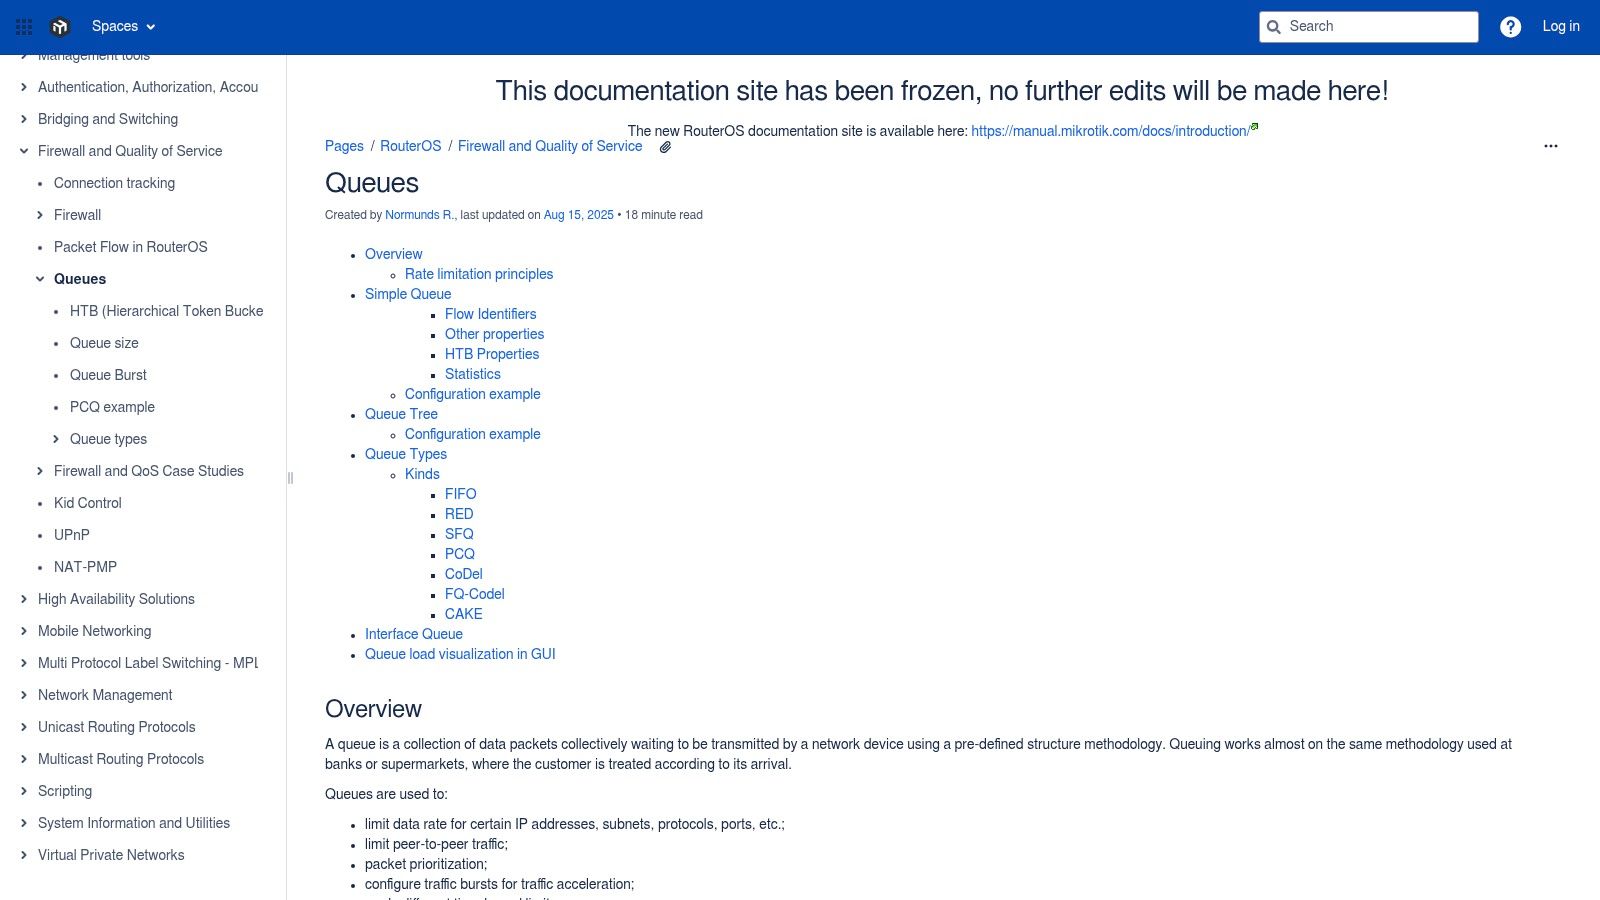
This is the tool that solves the “many users, one circuit” problem. It can enforce per-user or per-subnet fairness, which is exactly what you need when residential, mobile, datacenter, and IPv6 proxy traffic all behave differently in practice.
Why MikroTik is different
MikroTik acts at the network edge, so it can protect an entire segment instead of one endpoint. That's why it works so well for ad ops teams, account farmers, and operators feeding many browser profiles through one pool of links. It's also where you apply QoS in a way that matters for stable sessions.
Practical rule: Prioritize stable sessions and critical flows first. Don't chase raw throughput if the result is broken ad accounts and jittery logins.
The downside is complexity. Queue theory and CLI work can intimidate newcomers, and hardware limits can appear if you push very high throughput. Still, if you want real control over many users and many proxy types, MikroTik is often the first serious network-layer answer.
Top 10 Bandwidth Management Tools, Feature Comparison
| Tool | Core features ✨ | Target audience 👥 | UX / Reliability ★ | Value & Pricing 💰 | Standout / Strengths 🏆 |
|---|---|---|---|---|---|
| NetLimiter | Per-app upload/download limits, rule engine, real-time stats | Windows desktop/VM operators, bot/ad-tool users | ★★★★, lightweight & responsive | 💰 Per-host license; low-cost for single machines | 🏆 Extremely granular per-application control |
| NetBalancer | Per-process limits, DPI rules, optional cloud sync & VPN | Windows admins needing persistent caps across machines | ★★★★, stable with sync option | 💰 One-time license + 1yr updates; good TCO for endpoints | 🏆 One-time license + sync/VPN bundle |
| GlassWire | Per-app usage map, click-to-block firewall, visual timelines | Workstation operators, analysts needing quick forensics | ★★★★☆, excellent visuals; fast insight | 💰 Free tier; Premium for unlimited history/alerts | 🏆 Best visual connection/host insights |
| cFosSpeed | Kernel-level traffic shaping, per-protocol prioritization | Latency-sensitive scraping/streaming on Windows | ★★★★, very low overhead; improves latency | 💰 Low-cost single-host license | 🏆 Noticeable latency reduction under load |
| ManageEngine NetFlow Analyzer | Multi-vendor flow collection, dashboards, QoS & billing reports | SMB to enterprise network ops & capacity planners | ★★★★, feature-rich; enterprise-grade | 💰 Edition-based pricing; can be complex | 🏆 Deep reporting and deployment flexibility |
| SolarWinds NTA | NetFlow/sFlow/IPFIX analytics, CBQoS visibility, historical reports | Large enterprises using SolarWinds NPM stack | ★★★★, robust dashboards & history | 💰 Add-on licensing; can be costly at scale | 🏆 Strong ecosystem and polished dashboards |
| Kentik | Cloud-native flow analytics, BGP/telemetry correlation, DDoS detection | High-scale networks, multi-cloud operators | ★★★★★, very fast SaaS analytics at scale | 💰 Enterprise SaaS pricing (contact sales) | 🏆 High-scale, low-latency analytics & multi-cloud visibility |
| Plixer (Scrutinizer) | Flow-first forensic engine, long retention, security analytics | Security teams, NDR use cases, forensic analysts | ★★★★, powerful investigative workflows | 💰 Quote-based enterprise pricing | 🏆 Deep forensic & security-focused flow analysis |
| Paessler PRTG | SNMP/flow/packet sensors, alerts, dashboards, 100-sensor free tier | Small to mid IT teams, labs, quick PoCs | ★★★★, fast to start; unified UI | 💰 Free 100-sensor; sensor licensing can scale cost | 🏆 Broad protocol coverage and easy proof-of-concept |
| MikroTik RouterOS Queues | HTB/PCQ/CoDel/CAKE queueing, per-subscriber caps, QoS | Edge/router operators managing many clients | ★★★★, powerful but steeper learning curve | 💰 Very cost-effective on affordable hardware | 🏆 Inexpensive, segment-wide QoS and bufferbloat control |
Select the Right Tool for Your Operation
The best bandwidth management tools don't solve the same problem. NetLimiter and NetBalancer are endpoint governors. GlassWire helps you spot the noisy app fast. cFosSpeed protects latency under load. ManageEngine, SolarWinds, Kentik, Plixer, and PRTG move you into flow analysis and network-wide visibility. MikroTik sits at the edge and enforces policy across whole segments.
Pick based on the failure point. If one Windows machine keeps wrecking your campaign launch, use NetLimiter or GlassWire. If you need persistent process caps across multiple desktops, use NetBalancer. If your issue is jitter during scraping or uploads, use cFosSpeed. If you need to identify top talkers across a WAN, use ManageEngine or PRTG. If the traffic spans cloud, on-prem, and multiple sites, Kentik is the stronger observability layer. If you need forensics, Plixer gives you the deeper drilldown. If the problem is shared access across many users or proxy clients, MikroTik wins.
Proxy type matters too. Residential proxies behave differently from mobile, datacenter, and IPv6 proxies, and your policy should reflect session stability, congestion, and workload type rather than pretending all traffic is identical. Residential and mobile traffic often needs more patience from the network layer. Datacenter traffic usually pushes harder and faster. IPv6 can behave differently again depending on the destination and stack. That's why you don't treat proxy traffic as a single class when you're managing Facebook and TikTok ad accounts, cloaking, or account farming.
The market signal backs the operational reality. Mordor Intelligence estimates the network bandwidth management software market at USD 3.21 billion in 2025, rising to USD 3.41 billion in 2026 and reaching USD 4.63 billion by 2031, with a 6.29% CAGR from 2026 to 2031. That growth reflects a move toward continuous monitoring, historical reporting, and capacity forecasting instead of reactive troubleshooting, which is exactly the direction serious operators already take. Mordor Intelligence market outlook
A key bottleneck in modern networks is often policy accuracy under encryption, not just raw visibility. TLS, SaaS, SD-WAN, and remote work traffic make classification harder, so better dashboards alone won't save you. Use the simplest tool that gives you the control you require, then move up the stack only when the failure is bigger than the current layer.
If you're running proxies, ad accounts, or scraper fleets and you want cleaner traffic control without adding operational noise, start by tightening the network side first. Review your current proxy mix, map the traffic classes that matter, and then choose the bandwidth control layer that matches the failure. For infrastructure that needs stable sessions, fast provisioning, and city-level targeting across many workloads, evaluate Sota Proxy and put the traffic under control before the next campaign surge hits.
Related articles

7 Best Items to Resell for Profit in 2026
Discover the 7 best items to resell for profit in 2026. This guide covers sneakers, LEGO, and more for high-margin flipping with actionable sourcing tips.

Session Persistence for Proxy Operators and Antidetect
Master session persistence for proxy rotation and antidetect browsers. Learn sticky session types, TTL strategies, and SotaProxy setups.

What Is Geo Targeting: The Complete Guide for 2026
Learn what is geo targeting and how IP, GPS, and Wi-Fi signals shape it. Residential, mobile, and ISP proxies power real geo-targeted campaigns.

Contains in Xpath
Contains in xpath - Master the `contains` in XPath function. Get syntax, examples, advanced patterns, and performance tips for Selenium and proxy automation

Building a Reliable Multi-Account Stack with MostLogin and SotaProxy
Learn how experienced operators combine anti-detect browsers and proxies to build scalable, geo-targeted account management workflows using MostLogin and SotaProxy.
Inventory Monitoring Guide for Traffic Arbitrage Teams
Learn how inventory monitoring powers geo-targeted campaigns with real-time data, proxy scraping, KPIs and cost controls for Facebook and TikTok ad accounts.