Resource Limit Is Reached: Fixes for Proxies, Servers, And
Learn how to fix resource limit is reached errors on proxies, servers, and APIs with practical solutions for 2026.
You're in the middle of a launch, a client wants the next batch of accounts warmed, and the dashboard throws Resource Limit Reached again. The site was fine ten minutes ago, the proxy pool still has inventory, and the API layer is suddenly refusing to play along. That message looks simple, but in practice it usually points to one of three different ceilings, and the fix depends on which one you've hit.
Table of Contents
- Three Different Errors Behind the Same Message
- Diagnosing cPanel and CloudLinux Resource Faults
- Tuning Linux Servers and Container Limits
- Choosing the Right Proxy Type for Your Workload
- Proxy Pool Management and Rotation Strategies
- Monitoring and Prevention Framework
- Escalation Paths and Support Requests
Three Different Errors Behind the Same Message
resource limit is reached is not one error. In shared hosting, it often means the account has hit a concurrency ceiling, especially on cPanel and CloudLinux servers where the limiter tracks Entry Processes instead of raw traffic. On Linux systems, the same warning can come from ulimits, file descriptor caps, or process caps. In cloud and platform work, it can point to a quota error or API ceiling that needs a formal request, not a performance tweak.
Identify the environment first
If the message appears inside cPanel, check whether the failure lines up with WordPress activity, a landing page request, or a cron-driven PHP job. The first pass should focus on CPU usage, RAM/physical memory, and Entry Processes, because those are the counters hosting providers use to trace the fault path (hosting-side resource diagnostics). In CloudLinux setups, the issue is usually not “too many visitors” in the abstract, it is too many PHP workers trying to run at the same time.
If the message shows up in Azure, Oracle, or another control plane, treat it as a quota issue until the evidence says otherwise. Microsoft's quota guidance points operators to Usage + quotas and a request flow for raising the cap, which is a different fix from cache tuning or plugin cleanup (Azure quota error handling). Oracle's V$RESOURCE_LIMIT is another reminder that database session and process ceilings belong to their own class of fault.
Practical rule: if the fix changes request concurrency, it is a hosting or server limit. If the fix asks for more allowance in a region or service, it is a quota limit.
For traffic arbitrage teams running AdsPower, Dolphin Anty, GoLogin, Multilogin, or Hidemyacc across Facebook and TikTok ad accounts, that distinction saves time. A proxy pool exhaustion problem, a cPanel 508, and an API quota hit can all look like “the system is blocked,” but they need different responses. If you treat them the same, the deadline gets wasted on the wrong layer.
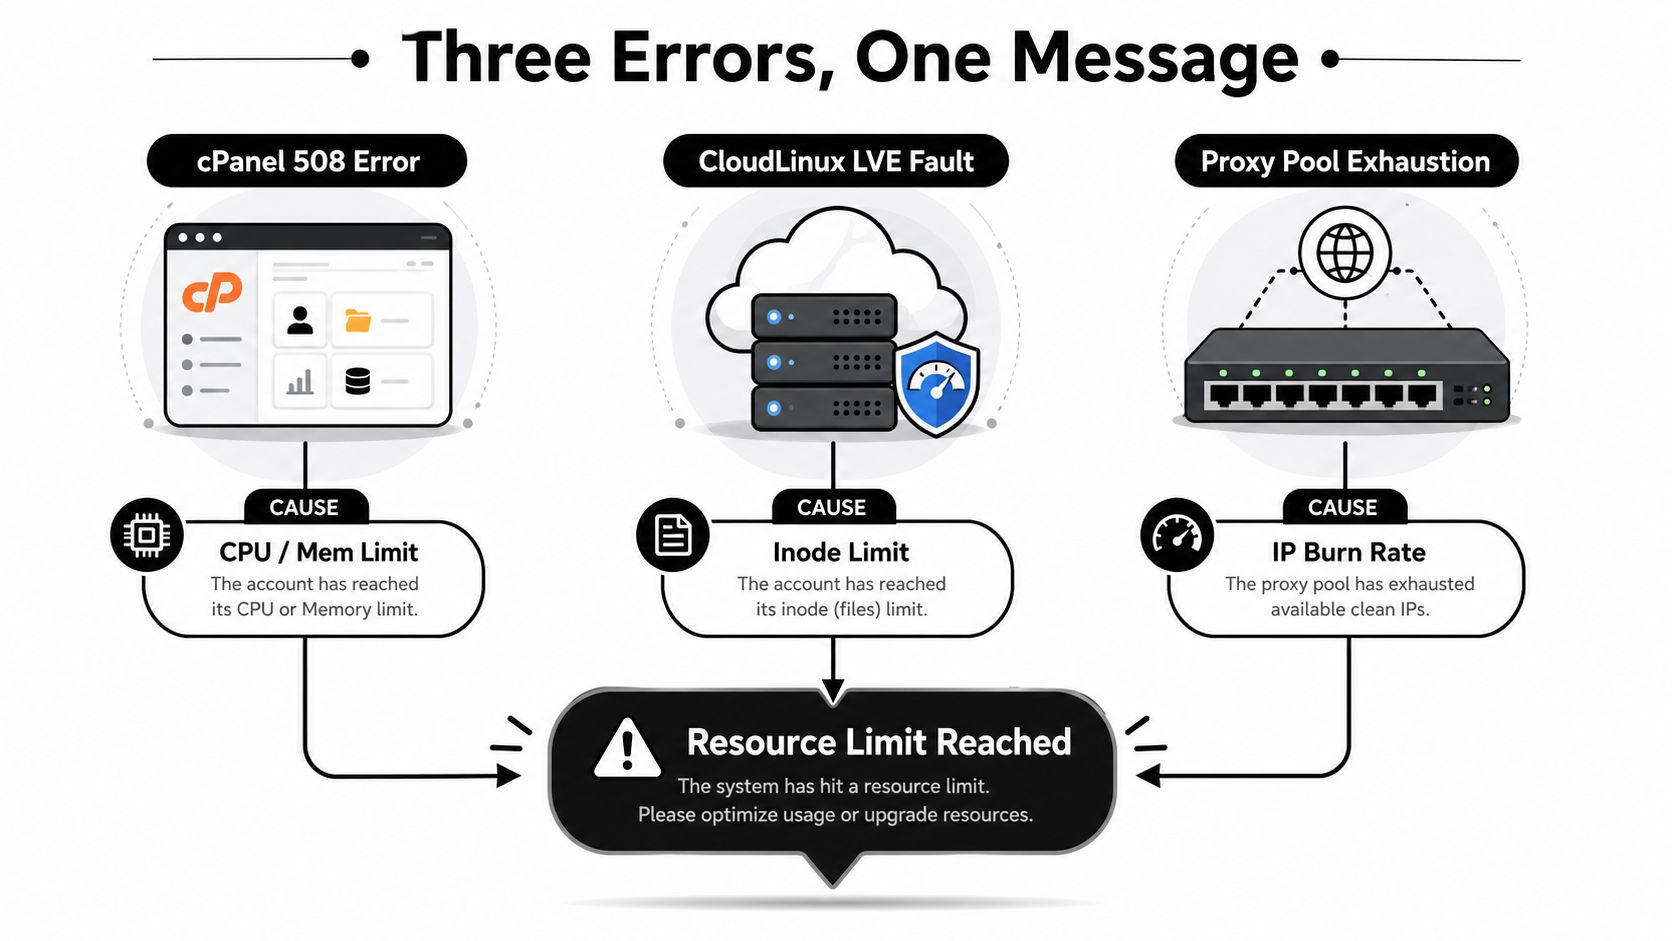
The fastest diagnosis is direct. Check the error context, note the timestamp, and ask what was running at that moment. If it was a login burst, cloaking redirect, import, backup, or bot sweep, the issue is probably concurrency. If the provider panel says quota, rate, or usage cap, stop tuning the app and go straight to quota management or provider support. For a related response-code reference, see the HTTP 503 explanation.
Diagnosing cPanel and CloudLinux Resource Faults
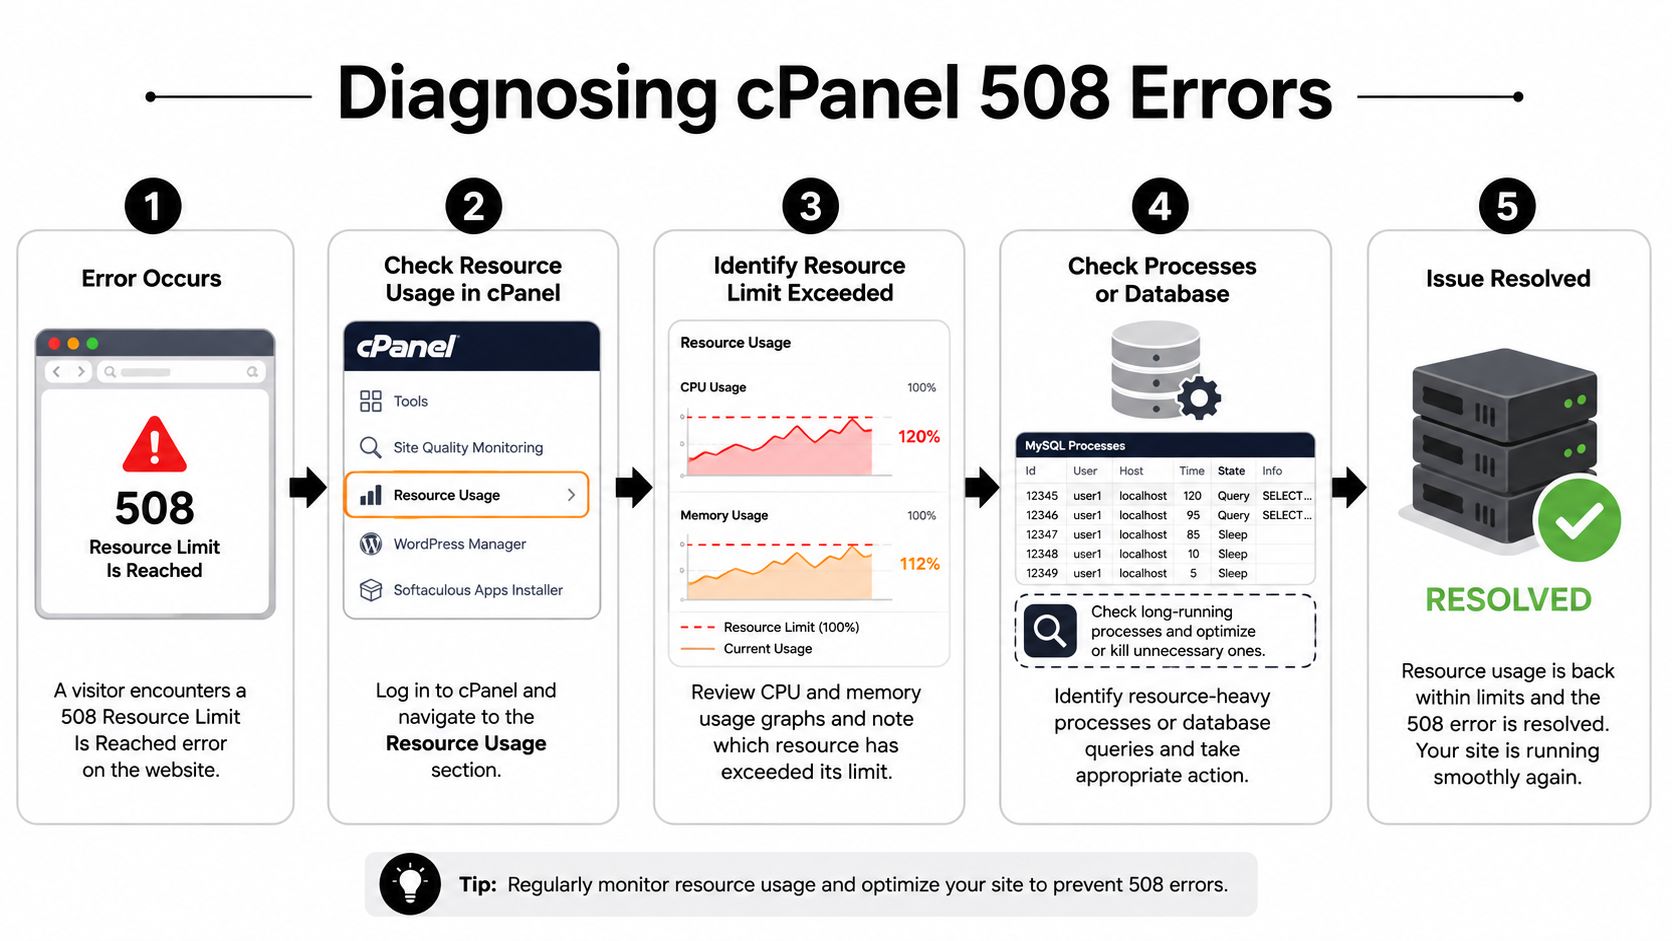
A cPanel 508 is usually not mysterious once you open the right panel. The key is to stop staring at average usage and inspect the exact fault window. Hosting guidance recommends going to cPanel → Metrics → Resource Usage, then checking the historical graphs for CPU, RAM, I/O, and Entry Processes, and matching those points with logs and the exact time the failure happened (cPanel Resource Usage diagnosis).
Read faults, not just averages
Average usage can hide the problem. A site may look calm across the day and still rack up a burst of faults during traffic spikes, cron runs, or bot activity. Hosting documentation treats the faults table as more useful than the average graph because a low daily line can still conceal repeated memory or entry-process faults during short spikes.
That matters for campaign traffic. A landing page hit by a Facebook ad burst can stay under the limit most of the day, then slam into it when several PHP requests land at once. The same pattern shows up with TikTok cloaking redirects, admin-ajax calls, or a queue of background tasks that wake up together.
Match the fault time to the workload
Once you have the timestamp, compare it to the site's activity. Check cron jobs, wp-cron, backup schedules, image generation, PDF creation, and security scans. Shared-hosting guidance points to those overlapping tasks as common causes of limit spikes, especially when they run alongside legitimate traffic (shared-hosting remediation steps). If the fault lines up with a recurring job, the likely culprit is already in front of you.
A low daily average does not prove the server is healthy. In cPanel, short spikes are what break the account.
That is why the first move is usually not to add more traffic or buy a larger plan. It is to identify whether one of these is driving the ceiling hit:
- CPU spikes, which point to heavy PHP work or costly queries.
- RAM faults, which usually mean memory-hungry plugins, exports, or scripts.
- I/O plateaus, which often come from backups, cache churn, or file-heavy jobs.
- Entry Process faults, which usually mean too many concurrent PHP requests.
Tuning Linux Servers and Container Limits
Once you leave shared hosting, the failure mode changes. Linux servers and containers don't hand you a friendly cPanel graph, they enforce ceilings through ulimits, file descriptor caps, and cgroup-based resource boundaries. If you're running proxy rotation services, account-farming stacks, or multiple browser profiles on a VPS, you need to check the operating system limits directly instead of guessing.
Check the live ceilings before you change them
Start with ulimit -a to see the current shell limits. Then inspect file descriptor pressure with lsof and /proc/sys/fs/file-nr. If the process count or open files keep climbing during browser automation, the problem might not be CPU at all, it might be that the server has run out of handles for sockets and files.
For persistent changes, raise both soft and hard limits in /etc/security/limits.conf. That's the file that controls what users and services can hold open after login or service start. If the workflow depends on many simultaneous Chromium instances, that adjustment often matters more than adding more browser nodes.
Treat containers differently from bare metal
Docker and Kubernetes add another layer. Docker's --ulimit flags let you set container-specific ceilings, while Kubernetes uses requests and limits to keep pods from dying under load. If your automation stack runs in pods, a container restart can look like a proxy issue when it's really a memory or process cap.
That's why buying a stronger box still matters. If you're sizing infrastructure for a heavier workload, a proper hardware catalogue helps you compare CPU, RAM, and storage choices before you commit, and the Amax IT server catalogue is useful for that kind of shortlist-building.
For teams managing many browser sessions, the practical sequence is usually this:
- Measure current shell limits with
ulimit -a. - Check open-file pressure with
lsofand file-nr. - Raise user limits in
limits.conf. - Set container ceilings with Docker or Kubernetes.
- Re-test under actual workload, not a toy load.
The operational idea is simple. A proxy-heavy stack can fail because it has no more sockets, no more files, or no more process slots long before it saturates CPU. If you don't measure the right ceiling, you'll keep buying capacity in the wrong place.
For broader capacity planning around request volume and throughput, the bandwidth management tools guide is a useful companion reference.
Choosing the Right Proxy Type for Your Workload
Proxy limits feel random until you line them up against the job you're doing. Residential, mobile, datacenter, and IPv6 proxies don't fail in the same way, and the wrong choice can make a campaign die halfway through setup. If you're doing account farming, cloaking, or geo-targeted campaigns across Facebook and TikTok ad accounts, pick the wrong proxy class and you'll burn the pool faster than the accounts can stabilize.
Match trust to the task
Residential proxies usually fit account creation and sensitive login flows better because they look closer to normal user traffic. The trade-off is quota pressure, since they tend to burn through allowance faster when you do lots of retries, warmups, or parallel sessions. Mobile proxies tend to perform well in stricter social workflows, especially where platform trust matters, but they're the most expensive operationally. Datacenter proxies can give you broad throughput for scraping and lower-friction workloads, but social platforms often block them more aggressively. IPv6 proxies work where the target supports them, but plenty of workflows still break because the platform, app, or browser stack doesn't like the address family.
For teams using antidetect browsers like AdsPower, Dolphin Anty, GoLogin, Multilogin, or Hidemyacc, that trade-off is practical, not theoretical. A browser profile that needs stable login behavior usually wants something closer to residential or mobile characteristics. A scraping or parsing job can tolerate datacenter ranges better, especially if the goal is raw throughput rather than account reputation.
Proxy type comparison for ad account operations
| Proxy Type | Trust Score | Cost per GB | Best For | Limitations |
|---|---|---|---|---|
| Residential | Higher trust with social platforms | Higher than datacenter | Account creation, warmups, cloaking | Quota burns faster |
| Mobile | Very strong trust for mobile-like behavior | Highest practical cost pressure | TikTok ad accounts, sensitive social workflows | Expensive and harder to scale |
| Datacenter | Lower trust on social platforms | Lowest cost pressure | Scraping, bulk checks, non-social automation | Blocks more often on ad platforms |
| IPv6 | Platform-dependent | Varies by provider | Specific compatible targets | Fails where IPv6 support is weak |
The right choice is workload-specific. If the job is a fresh Facebook profile with low tolerance for noise, residential or mobile makes more sense. If the job is bulk extraction or a less sensitive ops stream, datacenter is the more efficient choice. If the platform only supports one stack well, IPv6 can still be fine, but don't assume compatibility.
For a deeper breakdown of these classes, the proxy types guide is the cleanest reference to pair with this decision. For affiliate teams, Sota Proxy also runs a referral program with up to 40% commission, which matters if your margin model includes recurring proxy spend.
Proxy Pool Management and Rotation Strategies
A lot of proxy “resource limit” errors are self-inflicted. The pool wasn't exhausted by the platform, it was consumed by a rotation policy that churns IPs too fast or spreads sessions too thin. If you run multiple ad accounts, especially inside AdsPower or GoLogin, the rotation pattern needs to match the task, not just the theory.
Set rotation to the workflow, not to habit
Sticky sessions make sense for logins, profile warmups, and anything that needs the same identity to stay in place. Rapid rotation makes more sense for scraping, public checks, and short-lived requests that don't need continuity. If you rotate too aggressively during account setup, you force the platform to see too many identity changes. If you stay sticky too long during scraping, you waste clean IPs on tasks that don't need them.
Load distribution matters too. Don't run every account through the same provider bucket. Split high-priority accounts, test accounts, and disposable research jobs into separate pools so a single burst doesn't drain the whole operation. That keeps a bad test run from contaminating the production lane.
Monitor health before the pool goes dry
Use a dashboard that shows real-time usage and set alerts before the pool is empty. If you only notice exhaustion after the next login fails, you're already behind. City-level targeting can also reduce unnecessary IP churn because it narrows the target pattern instead of forcing the system to keep chasing fresh endpoints.
Rotation is a capacity problem, not just a routing problem. If the schedule is wrong, even a big pool disappears fast.
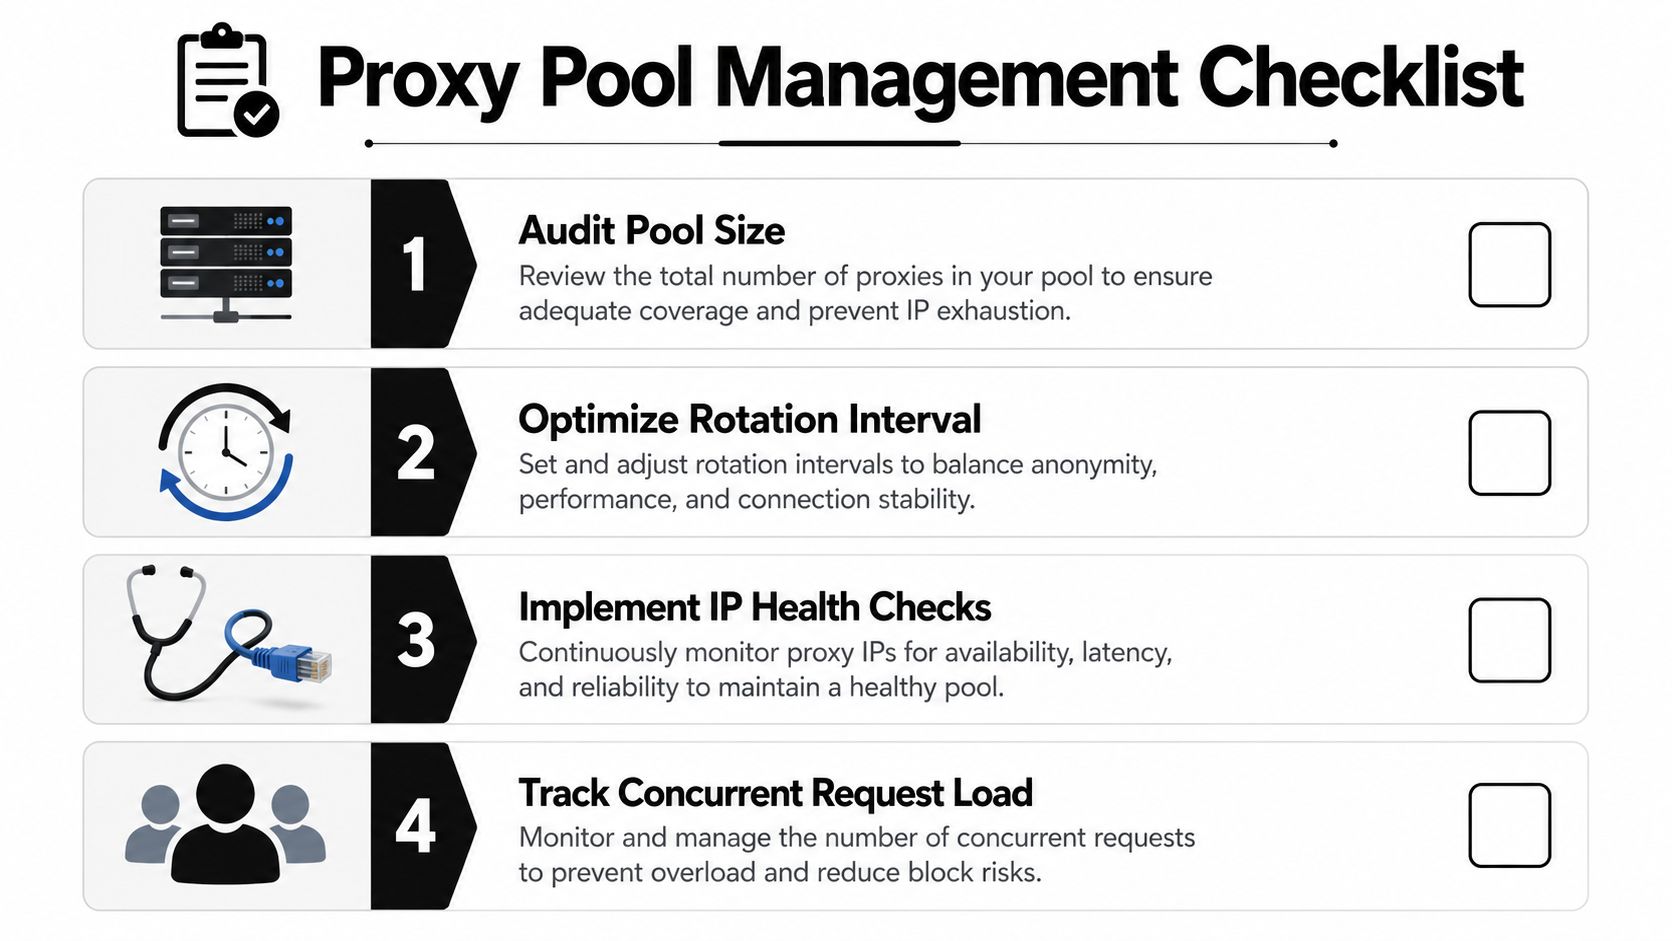
A practical proxy routine looks like this:
- Audit pool size against concurrent browser profiles and active campaign windows.
- Match rotation interval to task type, sticky for identity, fast for scraping.
- Check IP health before reusing addresses in sensitive flows.
- Track concurrent request load so one batch doesn't starve the rest.
For teams doing account farming or cloaking, proxy warming is also part of the equation. Gradually increasing usage makes the traffic pattern look less synthetic than a sudden hard switch. The point is not to game the platform with noise, it's to keep the workflow stable enough that the pool isn't wasting capacity on avoidable retries and resets.
For rotation tactics in more detail, the proxy IP rotation guide is the right follow-up.
Monitoring and Prevention Framework
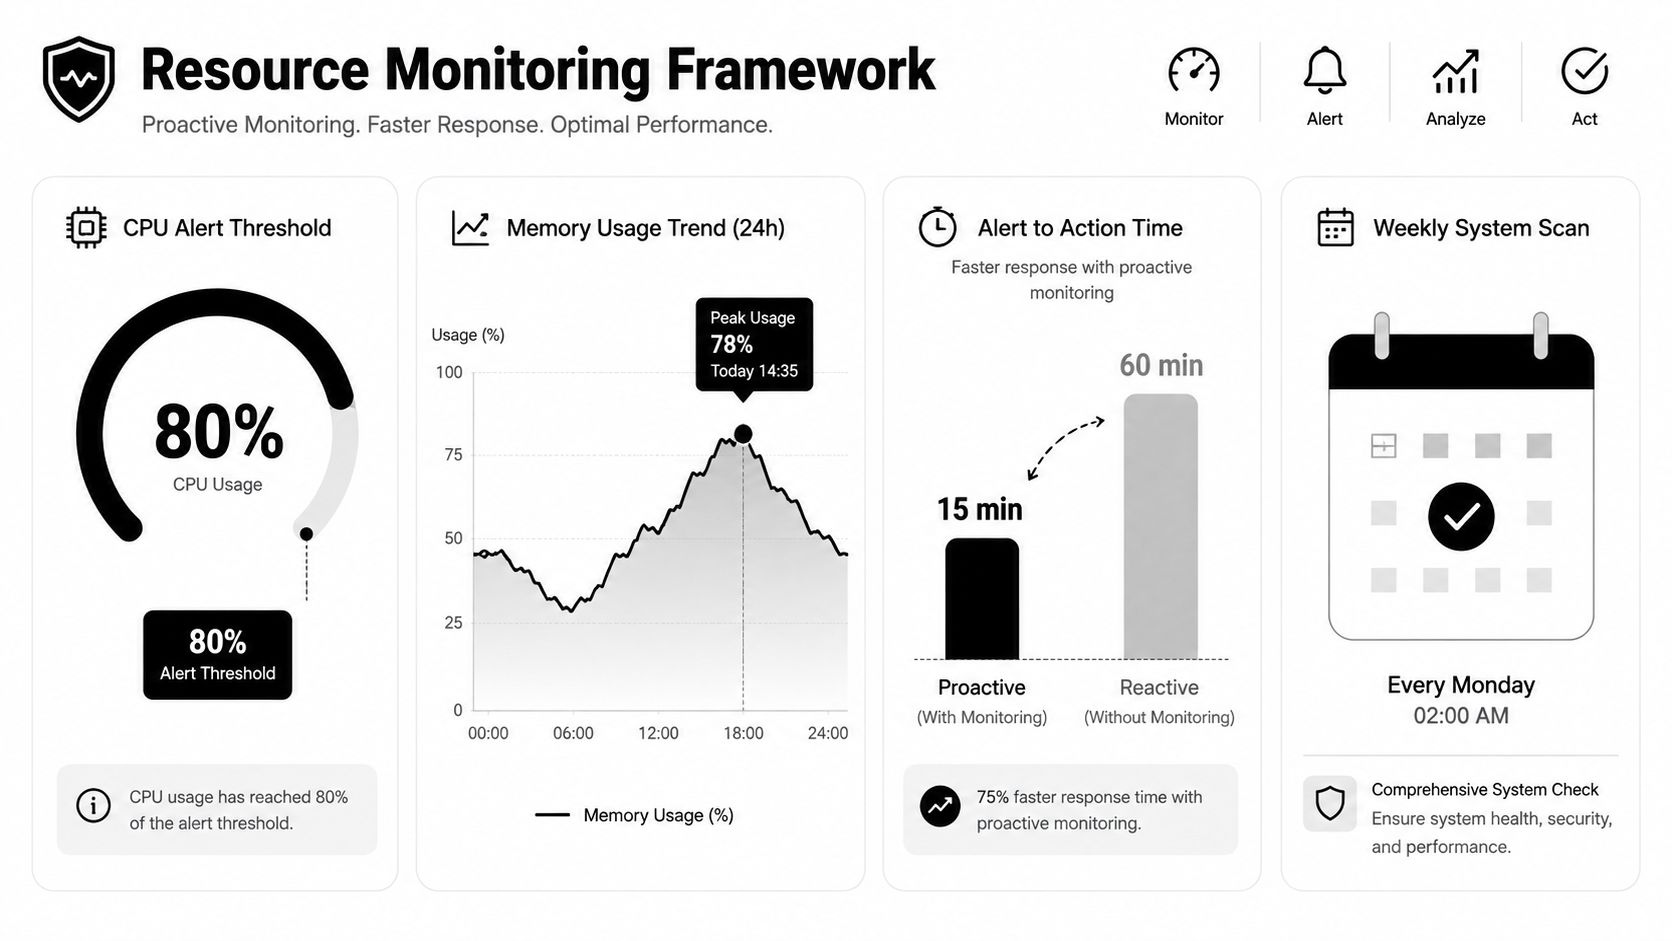
A campaign can look healthy one hour and start failing the next if you only watch alerts after users hit errors. Prevention means tracking the server, proxy layer, and API layer together, then reacting before any one ceiling becomes the bottleneck. In traffic arbitrage, that matters because account creation, cloaking, and campaign launches stress different parts of the stack at different times.
Build alerts around thresholds, not outages
On the server side, watch CPU, RAM, entry processes, and file descriptors. On the proxy side, track quota consumption, response times, and success rates. On the API side, monitor request volume against regional or service-specific caps. Azure quota guidance makes it clear that these limits are often scoped by region, so a single global assumption breaks down fast (Azure quota handling).
Alerts need to fire early. If the account or region is already refusing requests, recovery takes longer and the campaign loses momentum. A useful dashboard shows drift before failure, not just a red status after the fact.
Use monitoring to separate normal load from bad load
The question is not whether traffic is high. It is what kind of traffic is creating the pressure. A burst from a live campaign, a retry storm from a broken script, and a bot-like automation pattern all hit limits in different ways. Hosting guidance also points to cron jobs, wp-cron, and abusive bots as common triggers, which means monitoring has to separate workload shape from raw volume (shared-hosting pattern analysis).
A practical framework looks like this:
- Server metrics for capacity and concurrency.
- Proxy metrics for churn, quota burn, and request success.
- API metrics for rate and regional caps.
- Campaign tags so you can see whether account creation, cloaking, or ad management caused the spike.
The IT infrastructure performance metrics guide gives a useful baseline for how to structure those measurements. For day-to-day ops, the goal is simple, make the alert fire before the account goes red, not after the campaign has already stalled.
Escalation Paths and Support Requests
Sometimes the right fix is not more tuning, it's escalation. That might mean a quota increase, a hosting upgrade, a better proxy allocation, or a structural change in how the workload runs. The difference between a fast approval and a slow one usually comes down to the quality of the data you send.
Send support what it needs on the first pass
Before you open a ticket, collect the past 7 days of resource graphs, the exact error timestamps, the concurrent process count at failure, and the current plan limits versus what the workload did. That gives support a clean picture of whether you've got a burst problem, a chronic ceiling problem, or a misconfiguration. It also keeps you from getting bounced back with a generic “please provide more details.”
If you're asking a cloud provider for more headroom, use the platform's quota process rather than arguing about performance. If the provider documents a quota increase request, file it as a capacity request, not a bug report. If the issue is proxy-specific, such as IP pool exhaustion or regional availability, escalate to proxy support with the same evidence package and ask for a concrete allocation path.
Know when architecture has to change
Sometimes the right answer is a bigger shift. Shared hosting can't always absorb the workload that an aggressive campaign stack creates. In that case, moving to VPS or dedicated infrastructure is cleaner than asking for endless exceptions. The same logic applies to proxies. If one provider's pool can't sustain your login, warmup, and scraping patterns, split the workload or change the provider mix.
For proxy-specific help, the 24/7 customer support page is the right contact path when a pool issue needs immediate attention. For any support request, keep the message short and technical. State the error, the timestamp, the workload running at the moment, and the exact limit you believe was hit. That gets you faster triage than a vague complaint ever will.
If you need a cleaner way to keep campaigns, accounts, and proxy usage under control, visit Sota Proxy and compare the proxy types, locations, and rotation options against your actual workflow. It's a straightforward fit for traffic arbitrage teams that need stable infrastructure under deadline pressure.
Related articles
HTTP 503 Response Code: Fix Server & Proxy Errors
Understand the HTTP 503 response code. Practical guide for traffic arbitrage & automation teams: diagnose & fix server load & proxy issues.
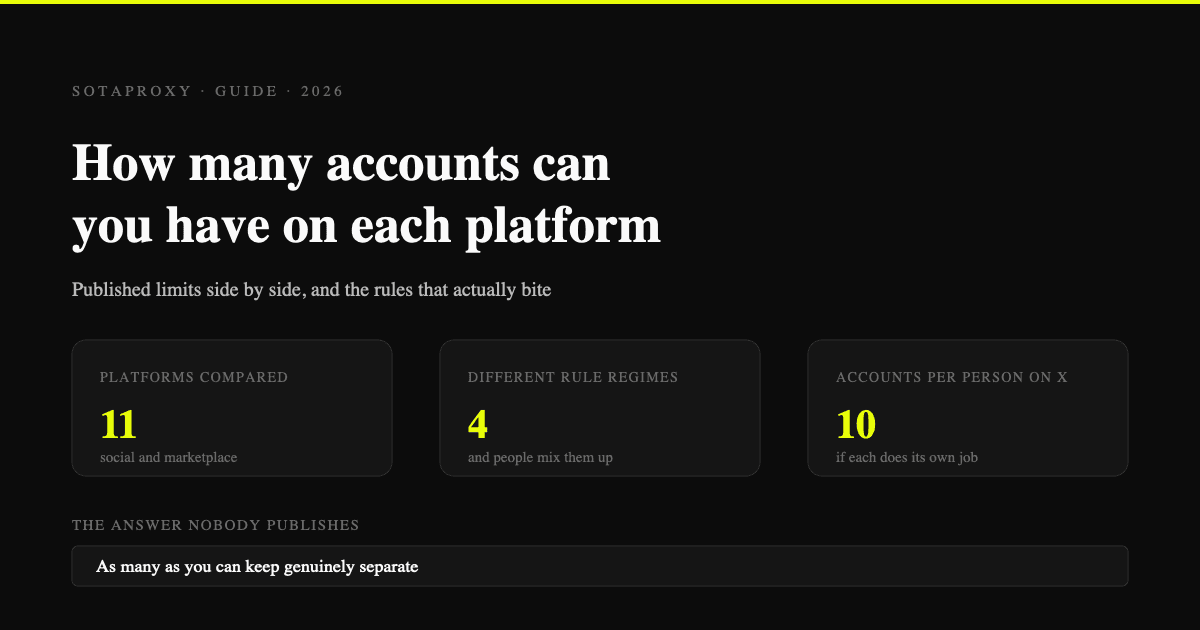
How Many Accounts Can You Have on Each Platform in 2026
Published limits for eleven platforms side by side, the four different rule regimes behind them, and why the number in the app is never the real constraint.

How Much You Actually Make on OnlyFans in 2026: The Full Fee Stack
The published earnings distribution, every cut between a fan's dollar and your bank account, when the money actually lands, and the one metric that decides whether promotion works.
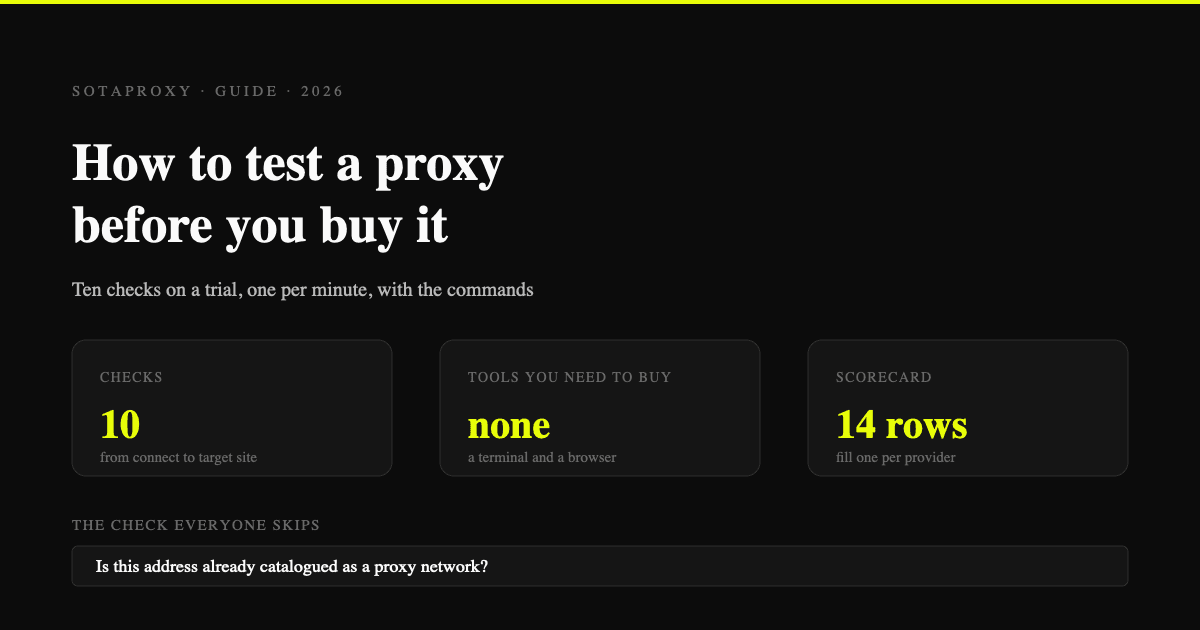
How to Test a Proxy Before You Buy It: A 10-Minute Checklist
Ten checks that tell you whether a proxy trial is worth paying for: exit ASN, hosting flags, rotation behaviour, subnet spread, DNS and WebRTC leaks, and success rate on your own target.

How to Make Money With Web Scraping in 2026: Five Models, Priced
Five ways scrapers get paid, what each one charges, and what a scrape actually costs to run, measured on real pages: HTML-only against a full browser render.

What a Multi-Accounting Stack Actually Costs in 2026
Real monthly numbers for 10, 50 and 200 accounts: antidetect profiles, proxies, numbers, cloud phones and card fees, with the one line item that eats three quarters of the budget.